

01Key Takeaways
- Samoa exported $42.91 million worth of goods in 2023, down 0.9% from $43.30 million in 2022, essentially flat, the most recent year with verified trade data available in this dataset.
- Mineral fuels led export categories at 41.7% ($17.88 million), by far the largest single category.
- New Zealand took 20.9% of exports ($8.98 million), the largest single destination, with American Samoa a close second at 19.7%.
- This dataset's trend data has a gap. It covers 2019, 2021, 2022 and 2023, but not 2020.
024-Year Trend
| Year | 2019 | 2021 | 2022 | 2023 |
|---|---|---|---|---|
| Value | $49.3M | $28.8M | $43.3M | $42.9M |
03Top Export Markets (2023)
| Rank | Partner | Value | Share |
|---|---|---|---|
| 1 | New Zealand | $9.0M | 20.9% |
| 2 | American Samoa | $8.5M | 19.7% |
| 3 | Australia | $5.6M | 13.0% |
| 4 | United States | $5.2M | 12.1% |
| 5 | Tokelau | $4.3M | 10.1% |
| 6 | Singapore | $2.4M | 5.5% |
| 7 | Other Asia, nes | $2.2M | 5.1% |
| 8 | Fiji | $1.6M | 3.7% |
| 9 | China | $1.2M | 2.7% |
| 10 | Cook Islands | $726.9K | 1.7% |
04Top Export Categories (2023)
| Rank | Category | Value | Share |
|---|---|---|---|
| 1 | Mineral Fuels, Mineral Oils and Products of their Distillation; Bituminous Substances; Mineral Waxes | $17.9M | 41.7% |
| 2 | Fish and Crustaceans, Molluscs and other Aquatic Invertebrates | $7.1M | 16.6% |
| 3 | Electrical Machinery and Equipment and parts thereof; Sound Recorders and Reproducers, Television Image and Sound Recorders and Reproducers, and Parts and Accessories of such Articles | $4.1M | 9.5% |
| 4 | Animal or Vegetable Fats and Oils and their Cleavage Products; Prepared Edible Fats; Animal or Vegetable Waxes | $3.8M | 8.9% |
| 5 | Edible Vegetables and certain Roots and Tubers | $2.0M | 4.6% |
| 6 | Preparations of Vegetables, Fruit, Nuts or other parts of Plants | $786.4K | 1.8% |
| 7 | Iron and Steel | $761.2K | 1.8% |
| 8 | Edible Fruit and Nuts; Peel of Citrus Fruit or Melons | $681.5K | 1.6% |
| 9 | Dairy Produce; Birds' Eggs; Natural Honey; Edible Products of Animal Origin, not elsewhere specified or included | $480.5K | 1.1% |
| 10 | Beverages, Spirits and Vinegar | $458.6K | 1.1% |
05Trade Partner Map
06Analysis
Export Value Held Nearly Flat in the Most Recent Year
Samoa exported $42.91 million worth of goods in 2023, down 0.9% from $43.30 million in 2022. This is the most recent year with verified trade data available in this dataset.
This dataset's trend data for Samoa has a gap. It includes 2019, 2021, 2022 and 2023, but not 2020. Export value stood at $49.27 million in 2019. It then fell sharply to $28.84 million in 2021. It recovered to $43.30 million in 2022, and held close to that level at $42.91 million in 2023.
Because 2020 is missing, this dataset cannot show whether that drop happened gradually or all at once. This dataset does not include information explaining what drove the decline or the recovery that followed. What is clear is that 2023 export value remains well below the 2019 level, even after two years of recovery.
Fuel and Fish Lead an Export List Topped by Two Categories
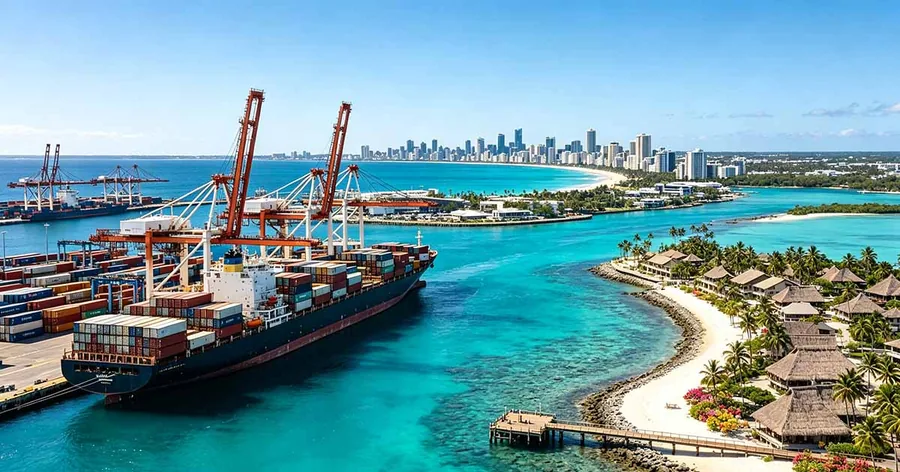
Mineral fuels and related products led every export category in 2023. They were worth $17.88 million, or 41.7% of the total, by far the largest single category. Samoa does not produce crude oil domestically. Port operators at Apia supply marine fuel to vessels calling at the port, including fishing vessels unloading their catch, a service that can register in trade statistics as a fuel export whenever a foreign-flagged vessel takes on fuel while in port. This dataset does not specify how much of Samoa's fuel export total reflects that kind of activity.
Fish and crustaceans, molluscs and other aquatic invertebrates followed at 16.6% ($7.12 million). Together, fuel and fish sit far ahead of every other category on this list. Electrical machinery and equipment added 9.5% ($4.10 million), and animal or vegetable fats and oils contributed 8.9% ($3.80 million).
Vegetables and certain roots and tubers added 4.6% ($1.96 million). Preparations of vegetables, fruit, nuts or other plant parts contributed 1.8% ($0.79 million), and iron and steel added 1.8% ($0.76 million). Fruit and nuts contributed 1.6% ($0.68 million). Dairy produce, eggs and honey added 1.1% ($0.48 million), and beverages, spirits and vinegar closed out the top ten at 1.1% ($0.46 million).
New Zealand and American Samoa Lead a Pacific-Heavy Partner List
New Zealand was Samoa's largest export destination in 2023, absorbing 20.9% of the total, worth $8.98 million. American Samoa ranked a close second at 19.7% ($8.46 million). Australia followed at 13.0% ($5.56 million), and the United States added 12.1% ($5.17 million). Together, the top three destinations made up 53.6% of total export value.
Tokelau contributed 10.1% ($4.33 million), and Singapore added 5.5% ($2.35 million). A category labeled "Other Asia, nes," a recognized catch-all classification within international trade statistics for shipments not assigned to a single specific destination, accounted for 5.1% ($2.18 million). Fiji added 3.7% ($1.59 million), and China contributed 2.7% ($1.16 million). Cook Islands closed out the top ten at 1.7% ($0.73 million).
Six of the top ten export destinations here, New Zealand, American Samoa, Australia, Tokelau, Fiji and the Cook Islands, sit in the Pacific region. American Samoa's presence so close to the top reflects its position as a major tuna processing hub. A StarKist cannery in Pago Pago produces as much as 80% of American Samoa's revenue and draws on regional fish supplies, a plausible link to fish appearing among Samoa's own export categories.
Taken together, this dataset's most recent confirmed year describes a small export economy split between fuel activity tied to Apia's port and fish and food products sold mainly within the Pacific region, alongside meaningful volumes reaching New Zealand, Australia and the USA.